¿Buscas una forma rápida de organizar información? El método de toma de notas Charting te facilitará mucho la vida.
En lugar de garabatear párrafo tras párrafo de notas, el método Charting organiza las notas en columnas y filas ordenadas. Cada columna representa una categoría, y se llenan las filas a medida que aparece nueva información. Eso es todo.
Funciona especialmente bien cuando se comparan cosas una al lado de la otra, como eventos históricos, clasificaciones científicas, características de productos o actualizaciones de diferentes departamentos en una reunión.
En esta guía, aprenderás exactamente cómo funciona el método de toma de notas Charting, cuándo usarlo y cuándo omitirlo por algo mejor. También te daremos ejemplos de notas Charting y una plantilla lista para usar.
Este artículo es parte de la serie de Plaud sobre métodos de toma de notas, donde desglosamos las estrategias más populares para que puedas mejorar tus habilidades de toma de notas. Si no te apetece dibujar tablas a mano, puedes generar notas de gráficos automáticamente después de cada reunión y conferencia utilizando los tomadores de notas con IA de Plaud.
Resumen del Método Charting
El Método Charting organiza las notas en columnas y filas. También podrías llamarlo tabla, dependiendo del contexto. Para la toma de notas, el Charting facilita el registro de información y su comparación entre categorías consistentes.
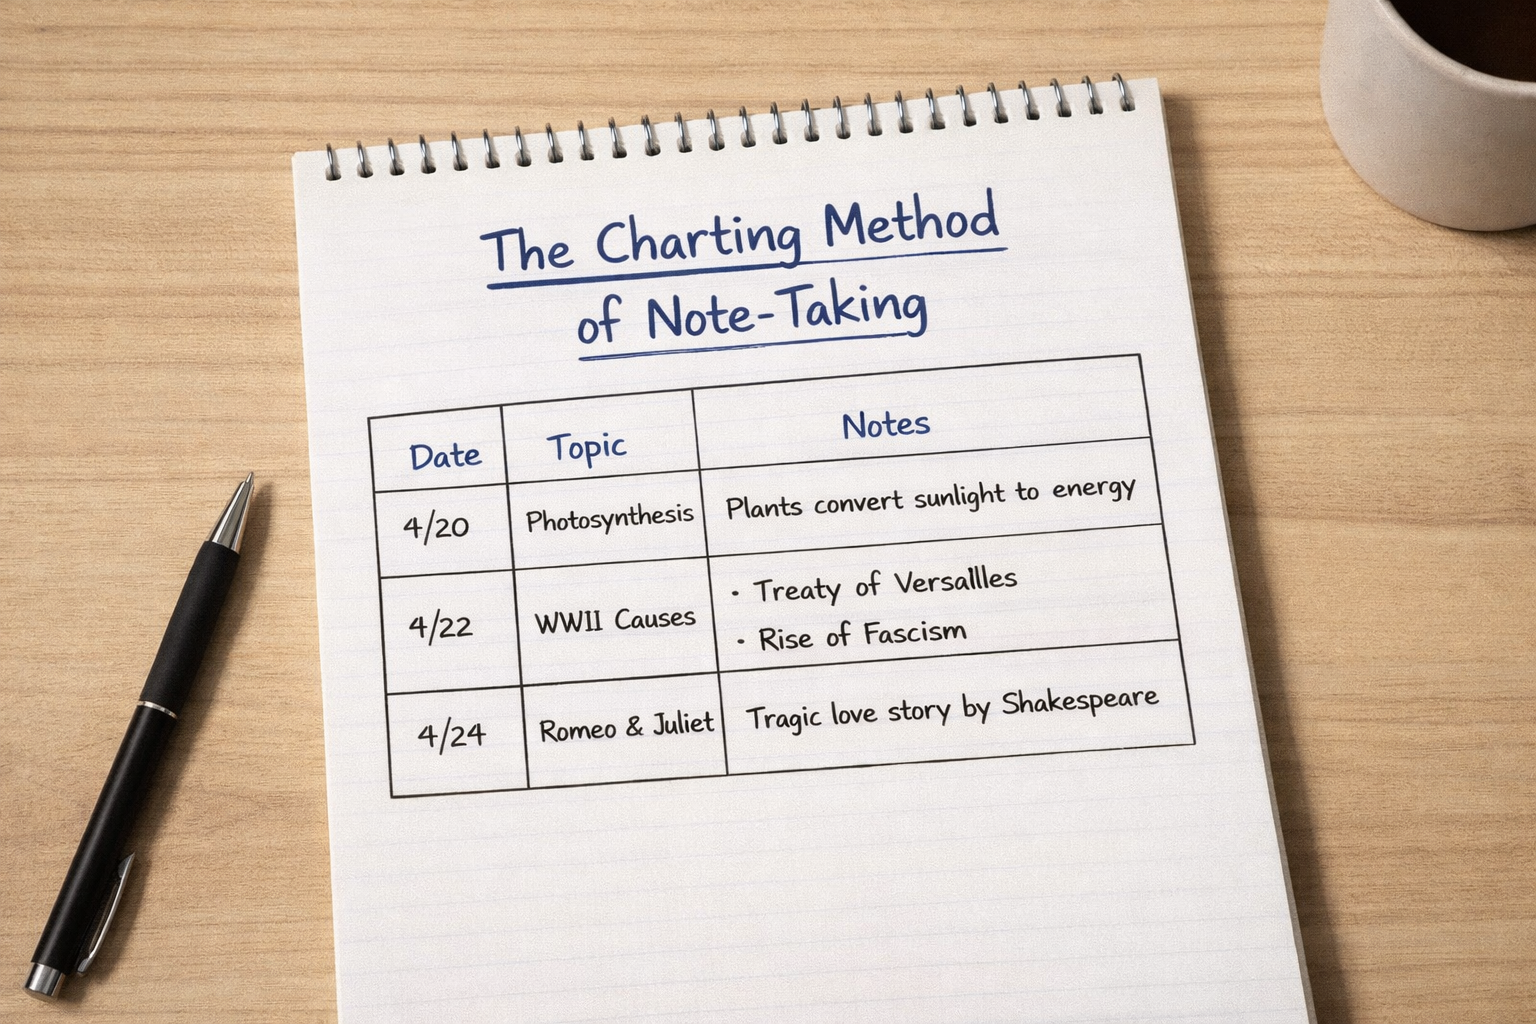
Aquí tienes un ejemplo de cómo podrías usar el Charting para ayudarte a estudiar historia de Estados Unidos:

Recomendamos utilizar el método de toma de notas Charting para temas en los que se repite el mismo tipo de información.
Por ejemplo:
-
Historia (fecha, evento, figuras clave, resultado)
-
Biología (organismo, características, hábitat, clasificación)
-
Reuniones de ventas (cliente, presupuesto, objeciones, próximos pasos)
-
Comparación de productos (características, precio, pros, contras)
Es especialmente bueno para los aprendices visuales. Si organizas naturalmente las cosas en hojas de cálculo, planificadores con códigos de color, o clasificas mentalmente los puntos clave e ideas principales en cuadros, te encantará esta estrategia para tomar notas.
¿No estás seguro de si eres un aprendiz visual? Aquí tienes una prueba rápida:
-
¿Prefieres diagramas a explicaciones largas?
-
¿Recuerdas dónde estaba algo en una página?
-
¿Te estresan las notas desordenadas de las clases?
-
¿Necesitas ver algo en lugar de recibir comunicación verbal directa?
Si respondiste afirmativamente a alguna de estas preguntas, definitivamente deberías probar el Método de Gráficos.
Pros del Método Charting:
-
Diseño limpio y estructurado
-
Ideal para comparaciones
-
Te ayuda a digerir grandes cantidades de datos visualmente
-
Fácil de revisar antes de exámenes o reuniones
-
Funciona bien para información repetitiva o con patrones
Contras del método Charting:
-
Requiere que conozcas tus categorías de antemano
-
No es flexible si los temas cambian
-
Demasiado rígido para discusiones creativas o de flujo libre
Lectura adicional: Si sigues escribiendo las notas de las reuniones a mano, estás perdiendo tiempo y sacrificando la precisión. Empieza a automatizarlas ahora con dispositivos de IA para reuniones.
¿Qué es el Método Charting para tomar notas?
El método Charting es un formato estructurado para tomar notas que organiza la información en columnas y filas para que puedas comparar ideas relacionadas rápidamente.
En lugar de grabar el contenido de reuniones o conferencias en forma de párrafo, creas categorías en la parte superior de una página. Cada vez que aparece nueva información, la colocas en la columna apropiada. Con el tiempo, tus notas forman una tabla limpia.
Te ayuda a capturar notas de forma eficaz porque obliga a la consistencia. Evalúas cada tema utilizando los mismos criterios, incluyendo puntos mayores y menores.
Aquí te explicamos lo que queremos decir.
Si estás estudiando casos judiciales importantes, tus columnas podrían verse así:

Ahora, cada vez que el orador menciona un punto importante, insertas los detalles en la misma estructura. Al final de la conferencia, tienes una forma de estudiar y comparar ideas.
Cuando revisas tus notas de clase más tarde, tu cerebro no tiene que decodificar párrafos desordenados. Puedes escanear horizontalmente para entender un tema, o verticalmente para comparar cómo se relacionan diferentes temas.
Puede que te interese: Si eres estudiante y buscas una mejor manera de tomar notas, consulta nuestra reseña de las mejores herramientas de IA para estudiantes.
El Método Charting funciona mejor cuando:
-
La información sigue patrones
-
Estás comparando múltiples temas
-
Conoces las categorías de antemano
Consejo profesional: Puedes convertir este método de toma de notas en tarjetas de memoria o notas. Simplemente haz que un lado de la tarjeta sea uno de los puntos clave, y el otro lado puede ser uno de los puntos de apoyo.
Ejemplo del Método Charting para tomar notas
Veamos cómo funciona esto en una situación de estudio real. El siguiente ejemplo muestra por qué este método es tan bueno para condensar y organizar notas visualmente. La información es densa, pero el Charting facilita su lectura y revisión.

¿Cómo funciona el método Charting?
Sigue estas instrucciones paso a paso para tomar mejores notas de clase con el Método Charting.
Paso 1: Identifica tus categorías
Antes de empezar a tomar notas, decide cuántos temas vas a comparar y cuáles son las métricas de comparación. Esto te ayudará a determinar cuántas columnas y filas necesitas.

Paso 2: Crea tus columnas
Dibuja líneas verticales en papel o inserta una tabla en Google Docs o Word.
Asegúrate de que tus columnas sean lo suficientemente anchas para información real. Si son demasiado estrechas, tendrás que meter el texto a la fuerza, y eso hará que sea más difícil revisarlas después.

Paso 3: Asigna títulos a las columnas para cada categoría
A continuación, añade los encabezados de categoría adecuados en la primera fila.
A veces es una buena idea codificar estas categorías principales con colores o usar texto en negrita.

Paso 4: Rellena las filas a medida que aprendes
Cada vez que aparezca un tema nuevo, comienza una nueva fila.
Introduce los detalles en la columna correcta a medida que avanzas. No te preocupes por escribir oraciones detalladas. Las frases cortas funcionan mejor.

Paso 5: Revisa buscando patrones
Al revisar las notas, busca similitudes y diferencias entre los temas.
Por ejemplo, podrías notar que casi todos los clientes con presupuestos más pequeños plantean objeciones de costo primero.
Resalta la información que se destaca o exige atención. Te ayudará a tomar decisiones más inteligentes en el trabajo o a obtener conocimientos más profundos durante el estudio.
¿Cuáles son las ventajas y desventajas del Método Charting?
El Método Charting tiene fortalezas y debilidades, al igual que cualquier otro sistema de toma de notas. Nos encanta porque visualiza instantáneamente patrones y valores atípicos en los datos, lo que nos ayuda a detectar ideas que podríamos haber pasado por alto durante las reuniones.
Y con Plaud AI, no tienes que hacer los gráficos tú mismo. Plaud extrae las categorías y los datos clave y genera gráficos automáticamente.
Pero el Charting puede fallar cuando se trabaja con discusiones no estructuradas.
A continuación, desglosamos dónde el Método Charting tiene éxito y dónde falla. También ofrecemos algunas alternativas de Charting que podrían funcionar mejor.
|
Criterio |
Ventajas (Por qué funciona) |
Desventajas (Dónde falla) |
La mejor alternativa |
|
Organización |
Organiza la información en comparaciones claras y directas. Facilita la visualización de patrones entre categorías. |
Requiere categorías previas. Puede fallar si el orador salta de ideas de forma impredecible. |
El método de flujo (Escribir ideas a medida que surgen y conectarlas naturalmente sin columnas rígidas.) |
|
Revisión |
Altamente escaneable. Escanea verticalmente para comparaciones u horizontalmente para temas completos. |
Puede parecer escaso o incompleto si se comprime demasiado detalle en las celdas. |
El Método Cornell (Usa una sección de resumen para añadir contexto y profundidad.) |
|
Velocidad |
Rápido una vez que las categorías están establecidas. Fomenta frases cortas en lugar de explicaciones largas. |
Más lento al principio porque hay que pensar en la estructura antes de escribir. |
El método de la oración (Simplemente escribe continuamente sin preocuparte por el formato.) |
|
Flexibilidad |
Ideal para temas estructurados como historia, biología, ventas o estudios de casos. |
Terrible para la lluvia de ideas, la narración de historias o las discusiones creativas. |
El Método de Mapas Mentales (Las ramas visuales permiten el pensamiento de flujo libre.) |
|
Retención |
Fuerza la escucha activa porque tienes que clasificar la información en la columna correcta. |
Fácil volverse mecánico y "llenar casillas" sin procesar profundamente el significado. |
El Método de Preguntas y Respuestas (Convierte las notas en preguntas para evaluar la comprensión.) |
|
Claridad Visual |
Diseño profesional que funciona bien en herramientas digitales y hojas de cálculo. |
No ideal para diagramas, ecuaciones o temas muy visuales como matemáticas o ingeniería. |
El Método de Encajonado (Separa ideas en secciones contenidas sin columnas de comparación estrictas.) |
¿Cuándo usar el método Charting?
Utiliza el método Charting cuando sepas qué información necesitas recopilar (por ejemplo, fechas, objetivos, nombres, precios, etc.). El Charting te ayuda a capturar la información que necesitas y a dejar de lado lo superfluo.
Pero si la discusión es impredecible o creativa, es posible que no sepas exactamente qué datos estás buscando. La lluvia de ideas es un buen ejemplo. En estos casos, el Método de Charting es demasiado restrictivo.
Usa el método Charting cuando:
-
Estás comparando múltiples temas con los mismos criterios
-
La conferencia sigue un formato predecible
-
Estás estudiando casos, eventos históricos, características de productos o actualizaciones de clientes
-
Quieres una revisión rápida y lado a lado antes de un examen o reunión
-
Ya conoces las categorías de antemano
Evítalo cuando:
-
El orador salta aleatoriamente entre ideas
-
Estás haciendo una lluvia de ideas o generando ideas
-
El material requiere diagramas, ecuaciones o muchos elementos visuales
-
No conoces la estructura de antemano
Alternativas al método Charting
Si el Charting no te funciona, significa que deberías cambiar a otro formato para tomar notas. Hay muchas alternativas que podrían adaptarse mejor a tu estilo de aprendizaje. A veces, incluso podrías cambiar entre métodos dependiendo del tema que estés discutiendo. A menudo cambiamos entre plantillas de notas, y muchos de nuestros clientes también lo hacen.
Aquí tienes algunos de nuestros favoritos.
El Método de la Frase

El método de la frase es probablemente el método más fácil para tomar notas. Es esencialmente solo tu típica "anotación de notas". Escribes cada nueva idea en una línea separada en tiempo real. Es desordenado pero rápido, lo que lo hace útil cuando la información se mueve rápidamente. Los periodistas usan este método durante las conferencias de prensa, y los estudiantes lo usan cuando los profesores son impredecibles. Por lo general, puedes arreglártelas escribiendo solo unas pocas líneas para la mayoría de los temas.
El Método del Esquema

El método del esquema es una forma de toma de notas que te ayuda a organizar las notas jerárquicamente utilizando la indentación. Al tomar notas digitales, este método se basa en gran medida en el botón de tabulación (especialmente a medida que los puntos menores comienzan a acumularse). El formato del esquema funciona mejor que el Charting cuando los temas se construyen uno sobre otro en lugar de compararse lado a lado.
El método de flujo

El método de flujo conecta ideas visualmente usando flechas y espaciado. Lo usamos para la lluvia de ideas, porque nunca te sientes encajonado o restringido (lo que puede pasar al graficar).
El Método Cornell

El método Cornell separa las notas en señales, puntos principales y resúmenes. Es bastante sencillo: El margen izquierdo es donde se escriben las señales, y el derecho es donde se escriben las notas adicionales. Puede ser el mejor método de toma de notas para estudiantes porque es un formato sistemático que contiene indicaciones de revisión incorporadas y una sección de recapitulación estructurada. Si alguna vez quieres recordar un punto específico, puedes echar un vistazo rápido y encontrarlo de inmediato. Por eso nos encanta.
El método AVID

El método AVID (también llamado método enfocado) se parece al método Cornell, pero va un paso más allá al fomentar la reflexión posterior. Este es otro para personas que intentan aprender cosas nuevas y mejorar su pensamiento crítico. Es mejor que el método de gráficos cuando tu objetivo es una comprensión más profunda en lugar de solo plasmar información en papel.
El método de agrupación

El método de agrupación organiza las ideas relacionadas en secciones separadas. Es como si una tabla explotara y las casillas se dispersaran por toda la página. Es más flexible que las tablas porque cada "casilla" puede contener diferentes tipos de información sin categorías de columnas estrictas.
Plantilla de método de gráficos de Plaud
En lugar de formatear tablas en Word o redibujar líneas en un cuaderno, ¿por qué no dejar que Plaud organice las notas por ti? Si eres estudiante, usar un dispositivo de IA te permite escuchar la conferencia en lugar de luchar por escribir notas en papel.
Nuestro tomador de notas con IA, Plaud Note, graba audio de conferencias presenciales, reuniones en línea o llamadas telefónicas y lo convierte en hermosas notas de gráficos con IA. Ni siquiera tienes que elegir las categorías. Plaud AI es lo suficientemente inteligente como para hacerlo todo (¡esa podría ser la razón por la que somos la marca de toma de notas número 1 del mundo!).
Todo lo que tienes que hacer es:
-
Elige una plantilla de método de gráficos de la biblioteca de plantillas de Plaud. O toma una foto de un diseño de gráfico que te guste y cárgala usando la función de foto a plantilla instantánea de Plaud.
-
Graba tu conferencia, reunión o llamada de ventas con Plaud Note o Plaud NotePin.
-
Sincroniza con la aplicación Plaud para generar automáticamente una transcripción y notas de gráficos estructuradas.
Nunca tendrás que preocuparte por el preformateo, el cambio de tamaño de las columnas o la reorganización de notas desordenadas después de clase. En su lugar, puedes concentrarte en la participación activa durante tus reuniones o conferencias.
Lectura adicional: Si crees que no necesitas un dispositivo para tomar notas con IA, lee nuestra guía sobre las mejores herramientas de IA del mercado para ver si hay algo que se adapte mejor a tus necesidades.
Para empezar, toma una foto de la siguiente plantilla de gráficos y súbela a la aplicación Plaud: